Play
Banner

White Papers

NOAA NMITS: A $2.1 billion Small Business IDIQ / GSA IT70 Contract Holders Only

  • 1/29/2019

NMITS IT Opportunity

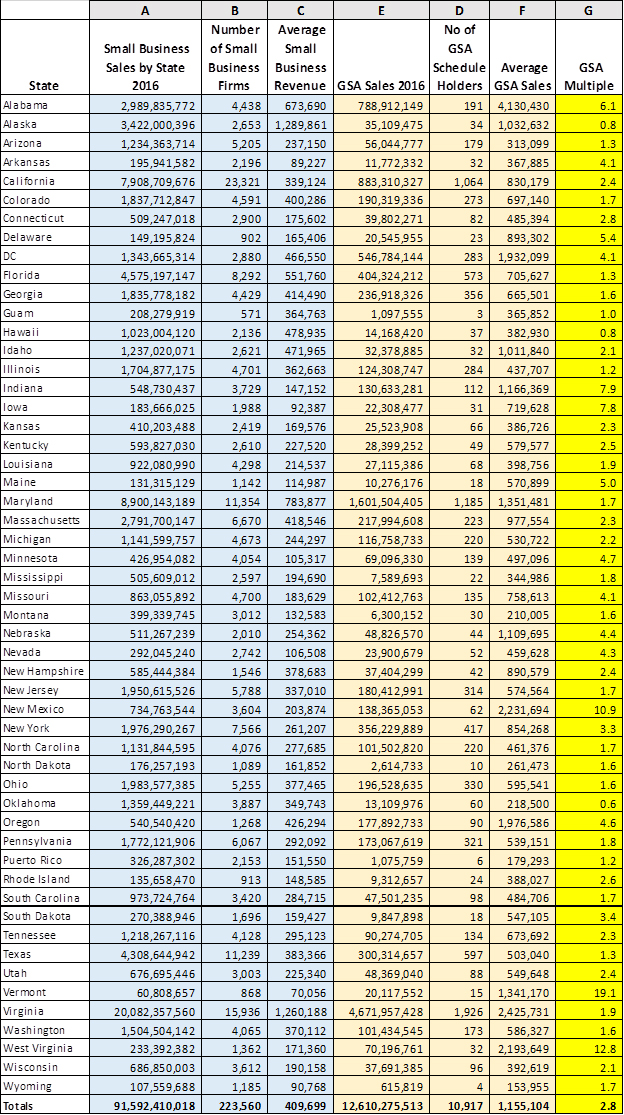
I talk about individual large contracting opportunities from time to time as occasionally I will get an email from someone that never spoke with me in the past but was awarded a place on one of these “difference maker contracts” and sometimes that person is one of our clients. NMITS is a large IT opportunity that I wanted to make sure my readers knew about. It is an additional opportunity for the 4,400 GSA IT70 Contract holders that shared $5.2B in federal IT contracting dollars ($1.2M avg.). This is another example of how having a GSA Schedule can provide a firm with access to large federal IDIQ (Indefinite Delivery Indefinite Quantity) Contracts and the huge opportunity those contracts often represent.

About NMITS

The National Oceanic and Atmospheric Administration which is part of the U.S. Department of Commerce has the mission of understanding and predicting changes in climate, weather, oceans and coasts and marine ecosystems and resources. In order to facilitate this mission they use a great deal of IT and Data Driven Services.

NMITS stands for NOAA Enterprise and Mission Information Technology Services and this $2.1B IDIQ contract is set to be awarded in Federal Fiscal year 2020. NMITS will replace the current NOAALink which contains a broad variety of IT disciplines. NOAA officials said that they anticipated approximately 25 awardees, but that the number is subject to change. This contract is likely to exceed the $2.1B stated amount as NOAALink the contract which NMITS replaces had a minimum $2.5 billion ceiling.

NOAA requires that offerors have a General Service Administration (GSA) Schedule 70 to bid on NMITS. During NOAA industry day, representatives from GSA explained how offerors can acquire or amend their GSA schedules via GSA FASt Lane Program to meet NMITS requirements by the time the RFP is released.

GSA FASt Lane Program

If you currently lack a GSA Schedule but would like to bid the GSA has indicated offerors could use the GSA FASt Lane Program to obtain a GSA Schedule Contract in as little as 60-120 days. NOAA has also indicated it would welcome joint venture and contract teaming arrangements; however, all members must have GSA Schedule IT 70.

Key Selection Criteria

Winning offerors will demonstrate extensive corporate experience and expertise in the service areas listed below in addition to crosscutting experience in program, quality, customer satisfaction, prevention, and continuous improvement management.

IT Professional Services includes
Cloud services (all associated labor);
Cognitive computing;
Conversion and implementation support;
Database planning and design;
Internet of Things (IoT);
IT project management;
Migration services (of all kinds);
Network services;
Programming;
Resources and facilities management;
Systems analysis, design, and implementation; and
Other Ancillary supplies and/or services. I think for the firms that obtain a place on NMITS contract it could be an enterprise altering award and for the rest know that there will be more opportunities like this for GSA Schedule Contract holders down the road.

The GSA Professional Services Schedule

  • 1/22/2019

The GSA Professional Services Schedule

The Professional Services Schedule is the second largest of the GSA Schedules. With that said it has 30 unique professional services many of which are light-years apart from each other. Therefore the reality is the Professional Services Schedule or 00CORP in many ways is the combination of many niche services and a few big ones.

The reason these schedules were combined into 00CORP was to reduce the administrative burden for firms that need access to more than one of these unique niches. Most small businesses utilize on average 3.78 niches or SINs and most large businesses utilize 4.88 SINs.

Even though these are unique niches the sales per firm are generally quite good. The average small business that holds the Professional Services Schedule conducts over $1MM per year in federal sales.

SIN Size # of Schedule Holders Sales Avg. Sales
ALL Small Business 3,261 3,281,300,000 1,006,225
ALL Large Business 1,045 4,150,600,000 3,971,866
Total (ALL) Combined 4,303 7,431,800,000 1,727,121

Range of Average Spending per SIN

The top SINs on the list often times have millions per year in average sales for the GSA Contract Holders. It is easy to see why one would want to be on that schedule. On the lower range we find items such as Training Services with only a few hundred thousand dollars. My most excited client of all time was a sole proprietor Management Training Provider that called me to let me know she broke $100K in Federal Sales in her second year on schedule. To a medium or large size business that amount of money would not have provided any excitement but to someone working out of their house it meant a great deal. Remember in that 3,261 small businesses some only have 1 employee.

How to use this Tool

Find the appropriate SINs for your firm and look at the level of competition. Generally it is better to have more firms on your schedule. It is usually slightly easier to gain access to these markets. Next look at the average sales for all the SINs your firm would provide services and determine if investing in a GSA Schedule would be right for your firm.

# SIN SIN Description Size # Firms Total Sales Avg. Sales
1 51 506 Office Imaging and Document Solutions Small Business 1 5,200,000 5,200,000
2 520 4 Debt Collection Small Business 36 94,800,000 2,633,333
3 51 504 Physical Records Management Solutions Small Business 2 4,000,000 2,000,000
4 871 3 Engineering Services - System Design and Integration Small Business 388 344,200,000 887,113
5 871 6 Engineering Services - Life Cycle Management Small Business 270 211,200,000 782,222
6 874 1 Integrated Consulting Services Small Business 1,183 884,200,000 747,422
7 874 9 Off-the-Shelf Training Devices and Materials Small Business 34 21,600,000 635,294
8 871 1 Engineering Services - Strategic Planning for Technology Programs/Activities Small Business 335 177,000,000 528,358
9 874 501 Logistics Worldwide - Supply and Value Chain Management Small Business 146 64,700,000 443,151
10 541 5 Integrated Marketing Services Small Business 162 71,500,000 441,358
11 382 5 Language Services - Services for the Visual and Hearing Impaired Small Business 41 15,100,000 368,293
12 874 8 Defense Acquisition Workforce Involvement Small Business 8 2,900,000 362,500
13 874 504 Logistics Worldwide - Deployment Logistics Small Business 64 22,600,000 353,125
14 520 13 Complementary Financial Management Services Small Business 224 77,800,000 347,321
15 874 507 Logistics Worldwide - Operations & Maintenance Logistics Small Business 85 29,500,000 347,059
16 871 7 Engineering Services - Construction Management and Consulting Services Small Business 153 52,300,000 341,830
17 874 7 Integrated Business Program Support Services Small Business 633 215,000,000 339,652
18 871 4 Engineering Services - Test and Evaluation Small Business 171 57,500,000 336,257
19 520 7 Financial & Performance Audits Small Business 105 35,100,000 334,286
20 899 1 Engineering Services - Environmental Consulting Small Business 442 120,900,000 273,529
21 520 16 Business Information Services Small Business 9 2,400,000 266,667
22 874 6 Acquisition Management Support Small Business 278 73,500,000 264,388
23 871 2 Engineering Services - Concept Development and Requirements Analysis Small Business 360 85,000,000 236,111
24 520 8 Complementary Audit Services Small Business 67 14,900,000 222,388
25 382 4 Language Services - Comprehensive Linguistic Analytical Support Services Small Business 14 3,100,000 221,429
26 520 11 Accounting Small Business 203 43,200,000 212,808
27 382 1 Translation Services Small Business 59 11,800,000 200,000
28 811 006 Facilities Maintenance and Management Solutions Small Business 1 200,000 200,000
29 C132 51 Information Technology Professional Services Small Business 122 23,400,000 191,803
30 874 4 Training Services: Instructor Led Training, Web Based Training and Educational Courses, Course Development and Testing Small Business 595 113,700,000 191,092

GSA Schedule – The Small Business Federal Contracting Picture

  • 1/31/2018

As a person who spends their day trying to show people the benefits of federal contracting when events like Monday’s government shutdown occurs. People are still interested in what I have to say. but there is definitely a lack of enthusiasm in people’s voices when I talk to them. So, this week I am going to share with you the Pros and Cons of small business federal contracting in hopes to demonstrate the value of a GSA Schedule.

I will start with the negative so I can end on a high note!

Cons to Federal Contracting

Federal Discressionary Spending

These numbers from a 1,000-foot overview are not all that exciting for jumping into the federal market place. Federal Discressionary spending has been flat for the last three years and significantly down from its highs earlier this decade.

Year Small Business Prime Spending
2017 1.07B
2016 1.08B
2015 1.10B
2014 1.01B
2013 1.15B
2012 1.29B
2011 1.30B
2010 1.38B

Small Businesses? Where did everyone go?

Federal government has lost 25% of all small business prime contractors over the past six years.

Year Number of Small Business Federal Contractors
2016 105,000
2010 140,000

Pros to Federal Contracting

Small Businesses are Cleaning up

In 2017 according to USA Spening.gov the federal government increased spending with small businesses by 10% and reached its highest levels in history. Small businesses are providing better solutions and finding their niches more than ever in the federal marketplace.

Year Small Business Prime Spending
2017 109.7B
2016 99.9B
2015 90.7B
2014 91.7B
2013 83.1B
2012 89.9B
2011 91.5B
2010 97.9B

Small Businesses Down / GSA Contract Holders Up

GSA Schedule Holders increased around 7% over the past six years while small businesses declined greatly overall. This is more than likely the fact that the GSA Schedule holders were being successful in federal contracting while their counterparts without a schedule had difficulty maintaining their contracts.

Year Number of Small Business Federal Contractors GSA Contract Holders
2016 105,000 15,000
2010 140,000 14,000

My Interpretation

In 2008-2009 small business raced into government contracting to survive, the government was spending large amounts of discressionary funding in an attempt to rebound from the recession. In 2010 the average small business contractor received $700K in federal contracts.

In 2013 the we saw nearly a 15% drop in small business contracting. The dollars dried up and the firms went away. Firms looked at the overall numbers and saw the federal government was not increasing spending and stayed out. As a result we have an environment today where the average small business doing work with the federal government is doing over $1MM in federal contracting.

A reason to look towards a GSA Schedule is that those Contract Holders didn’t go anywhere and as a result thrived throughout the decade.

GSA IT 70 Health IT SIN (Update) First Contract Awarded

  • 4/17/2017

New Healthcare IT SIN First Contract

The first GSA Contract has recently been awarded of the new Healthcare IT SIN 132-56. It was a $567K contract awarded to a small business. We expect as this SIN is adapted large IT buys will take place from the VA in 2018 and beyond.

Competition Profile of this SIN

There are over 3,500 firms on GSA IT 70 and 160 of those firm have adopted to hang a shingle on the new SIN. 44 of the firms are the same large businesses that have large presence in the federal IT world such as IBM, Booze Allen, and General Dynamics Information Services. The Small Business Segment is loaded with the most federal savvy and most agile small business IT firms. The Small Businesses on this schedule have average annual sales with the federal government of $19MM, the average for a small business IT 70 holder is $3MM.

Why are so few firms enrolled on the new SIN?

There is a misnomer in the industry that the firm must have past Healthcare IT experience in order to qualify for this schedule. This is not the case, IT experience yes, able to list IT Healthcare Positions in their proposal with prevailing industry rates yes but no past experience in Healthcare IT is required. These are issues that can be worked through with a strong industry consultant.

What is the potential?

The VA has been a major adapter of the GSA Federal Supply Schedule System. They purchase $11 billion per year from their own set of GSA Schedules. The schedule system has been a success story for this agency. The VA is likely to spend a sizeable portion of its $4.4B budget with vendors on the new Healthcare IT Schedule. They have a vested interest in seeing this schedule success and they are a major stakeholder in the development of this schedule.

How Large is the VA Hospital System?

To put this Hospital System in perspective only six states have more hospitals than the VA system, California (349), Florida (212), New York (202), Ohio (152), Pennsylvania (177), and Texas (382). The total approximate budget for the VA system is $163.9 billion. Expect this to be a high IT spending growth area for the next few years and in my opinion following new federal spending is generally easier to sell than existing spending.

Facility Type Number
Hospitals 151
Vet Centers 300
Clinics 820

If your firm is looking to grow in the Federal IT market don’t miss this opportunity to get into the new Healthcare IT market before the players have all been established and you are fighting from a second mover position. The most federal savvy IT firms have already entered the market but the number of firms on the Schedule is still way below expectations and therefore there is still time to act.

What is the GSA Sales Advantage in Federal Contracting for Small Business?

  • 2/27/2017

What is the GSA Sales Advantage in Federal Contracting for Small Business?

Answer: Approximately 3-times

Firms that sell to the federal government with a GSA Schedule have a 2.8X Advantage over their small business competition without a GSA Schedule. This advantage grows to over 3X if we take out small business construction firms doing federal work as these projects are not available for purchase from GSA Schedule Holders.

  C
Average Small Business Sales non-GSA Schedule Holder
F
Average Small Business GSA Schedule Holder Sales
G
Multiple
Small Business Totals $409.7K $1.16MM 2.8X
Small Business Totals w/out Construction $369.7K $1.16MM 3.1X

For the 200,000 plus small business federal contractors that are attempting to compete in the federal marketplace without a GSA Schedule the largest problem they face is the lack of a consistent contracting vehicle. This inhibits sales because federal agencies that are ready to buy from a vendor need a contracting vehicle to do so.

GSA Schedule = Contracting Vehicle

A GSA Schedule solves this issue so that when a meeting of the minds between buyer and seller can take place, otherwise there is no market. This is because a federal purchase must take place in compliance with FAR (Federal Acquisition Regulation). FAR insures fairness and competitiveness throughout the federal buying process. Having a GSA Schedule contracting vehicle in place can lessen the time burden of a purchase from putting something out for bid at over 200 days to the average GSA Schedule time of several weeks or days, while meeting all FAR requirements. This is why GSA Schedule Holders consistently outsell their small business peers without GSA Schedules.

Data Set Listed Below:

GSA Sales Advantage

GSA IT70 Now taking over State IT Contracting? At least it is in Florida!

  • 12/8/2016

GSA IT70 Now taking over State IT Contracting? At least it is in Florida!

Most States have adopted GSA Piggyback programs where the State buyers are permitted to purchase using the Federal Supply Schedules or GSA Contracts. This saves the state the effort of enticing contractors onto their own supply schedules and allows the state to take advantage of GSA pricing. This is an offshoot of the Federal 1122 Program designed to help State and Local governments obtain supplies to counter terrorism.

State of Florida taking things a step further
Florida Department of Management Services has moved from traditional IT buying to using the Federal GSA Schedule IT 70 for Software and Computer Hardware exclusively. The reality is that even a state as large as Florida the 3rd most populated state in the country with over 20 million people has difficulty maintaining a separate schedule system that has the number of reputable vendors and pricing as the Federal System. Therefore they are converting to utilizing the Federal GSA Schedule System.

The largest two states by population and IT spending California and Texas already have their own state run Schedule Programs CMAS (California Multiple Award Schedule) and TXMAS (Texas Multiple Award Schedule). Both of these schedule systems allow for reciprocity and some integration such as if the holder already has a GSA Schedule Contract they can easily obtain a place on these MAS Programs. Additionally for example if a firm has their GSA Schedule terminated than they are also removed from the CMAS program as well.

Is Florida then the Cutoff?
If Florida is the 3rd Largest State but the 7th in terms of IT Spending. Florida opting to utilize the GSA Schedule System instead of creating their own Multiple Award System most likely signals that only the largest states going forward will find it practical to maintain their own MAS system and the other 43-48 states will gradually follow Florida in using 100% Federal GSA Schedule Vendors. Cooperative Purchasing through the GSA Schedule maybe only a few years from taking over the $30-35B State Government IT Industry.

Below is a list of the top 15 States IT Budgets:

Rank State State IT Spending 2017 Est
1 California 5,027,400,000
2 Texas 2,832,900,000
3 New York 2,354,100,000
4 Pennsylvania 1,449,700,000
5 Michigan 1,316,700,000
6 Illinois 1,197,000,000
7 Florida 1,143,800,000
8 Ohio 1,064,000,000
9 North Carolina 1,010,800,000
10 Georgia 970,900,000
11 Maryland 944,300,000
12 Arkansas 851,200,000
13 Wisconsin 837,900,000
14 Tennessee 784,700,000
15 Massachusetts 665,000,000

GSA - Can Small Businesses Compete in the Federal Market?

  • 7/14/2016

by: Bob Steger
tel: 303-810-4580
email: bsteger@advancegsa.com

GSA - Can Small Business Compete in the Federal Market?
There are several aspects to the answer of this question.

First
The federal government segments its vendors into the categories of large and small business. Large business receives a greater portion of the $352B in federal procurement however in 2015 small businesses accounted for over 25% of federal procurement or $90.7B. The federal government has a goal of 23% of all procurement dollars being spent with small business and does a good job of reaching that target. So by goal small businesses are required to be included in federal contracting. This is additionally demonstrated by FAR rules for purchasing that set an entire class of contract aside for small business.

Simplified Acquisition Threshold (SAT) - $3,500 - $150,000 (in most cases)
Procurements under within the SAT parameters are legally reserved for small business. SAT procurements represent approximately 4% of the federal budget or $14B of which all goes to small business.

Second
Looking at one of the smaller GSA Schedule SINs as an example (security installation) we see that small businesses fill a niche while competing in the same market. The larger firms focus on major projects with large scale technical demands while the smaller firms use their agility to compete on price and speed on smaller projects. This is seen by the firms on this schedule federal sales performance. For the 74 small firms in this industry averaging $3MM per year in federal sales is a good take for these small businesses.


# of Firms

Firms with Federal Revenue

Percentage

Average Federal Revenue

Large Firms

36

34

94%

$909MM

Small Firms

90

74

82%

$    3MM

Third
Micro Purchases – Federal Purchase <$3,500 (small and large firms openly competition)
One would think that larger firms would dominate this market selling items to the federal government at lower costs via economies of scale. However what we find is that 30% of the $20B the federal government spends using federal credit card or micro purchases is spent with small business or $6-7B. This figure is even greater than the 25% small business receives overall and this parity is partially due to the exposure a small business receives by placing its goods and services on GSA Advantage the de facto directory for federal contractors.

Small Biz vs Large Biz
Overall there is some crossover where the two different sizes of entities compete directly however small businesses provide better value in many areas and are therefore sought out in niche markets.

A GSA Schedule is your first step in entering the federal market place. If you would like for me to run an analysis for your firm to see what type of impact a GSA Schedule could provide your business, give me a call and I am always happy to discuss. Knowing the size of the federal marketplace in your industry is the first step in making a strategic decision as to whether you should view the federal government as a growth area for your business. Please feel free to give me a call at 303-810-4580

Book Free Consultation WEBINAR